Data ingestion
Imported the Kaggle telecom dataset into MySQL with a typed relational schema. SQL-first storage keeps the data honest and gives a single queryable source of truth for all downstream steps.
Table of Contents
ToggleCustomer churn analysis in the telecom industry is one of the most business-critical issues in any subscription company.I built this because customer churn is expensive in a way that compounds. Telecom companies run on monthly recurring revenue and long-term relationships.
Own every step, including data ingestion, cleansing, modeling, and a dashboard that a retention team may genuinely use rather than just running a model and taking screenshots of its correctness.
I created this project to put into practice what a true analyst job requires: owning the entire pipeline, from a raw MySQL database to a Power BI dashboard that a retention manager can access and take action on the same afternoon, rather than simply running a model in isolation.
This telecom customer churn analysis was built around three core business questions..
Who is likely to churn? Why are they leaving? And what can the retention team do before they do—not after?

Three factors support the business operations of telecom companies: intense competition with cheap switching costs, long-term customer relationships, and monthly subscription revenue. A turnover rate higher than 26% indicates the following:
Retained customers contributed a median of ₹1,683.60 in total revenue, as demonstrated by the median lifetime charges gap. Just ₹703.50, or less than half, was made by churned customers because they departed before the business turned a profit. The most costly type is early churn.
The dataset covered four feature groups from the Kaggle Telco Churn dataset:
After framing them, I opened a notebook. In addition to making the final recommendations credible rather than post-hoc, hypothesis-first analysis keeps every query and visualization rooted in something that can be tested.
New customers churn at a higher rate than long-term ones.
Higher monthly charges increase the probability of leaving.
Month-to-month contracts carry more churn risk than annual plans.
Digital billing preferences and service bundles influence churn behaviour.
The findings supported each of the four hypotheses. The project's most remarkable result came from H1.
The telecom customer churn analysis pipeline ran across five stages
Imported the Kaggle telecom dataset into MySQL with a typed relational schema. SQL-first storage keeps the data honest and gives a single queryable source of truth for all downstream steps.
Connected via SQLAlchemy, fixed TotalCharges (source stored it as string), resolved ~11 missing rows, and engineered a tenure_group feature: 0–12, 13–24, 25–48, and 48+ months. That bucketing is what made the early-churn pattern visible in charts.
Compared median tenure, monthly charges, and lifetime value across churned and retained segments. Clean aggregations — no over-engineering — that were presentable to a non-technical stakeholder without explanation.
Trained Logistic Regression and Random Forest classifiers. The output that mattered was not accuracy — it was an individual churn probability score for every customer. A score of 0.74 is actionable; "82% accuracy" is not.
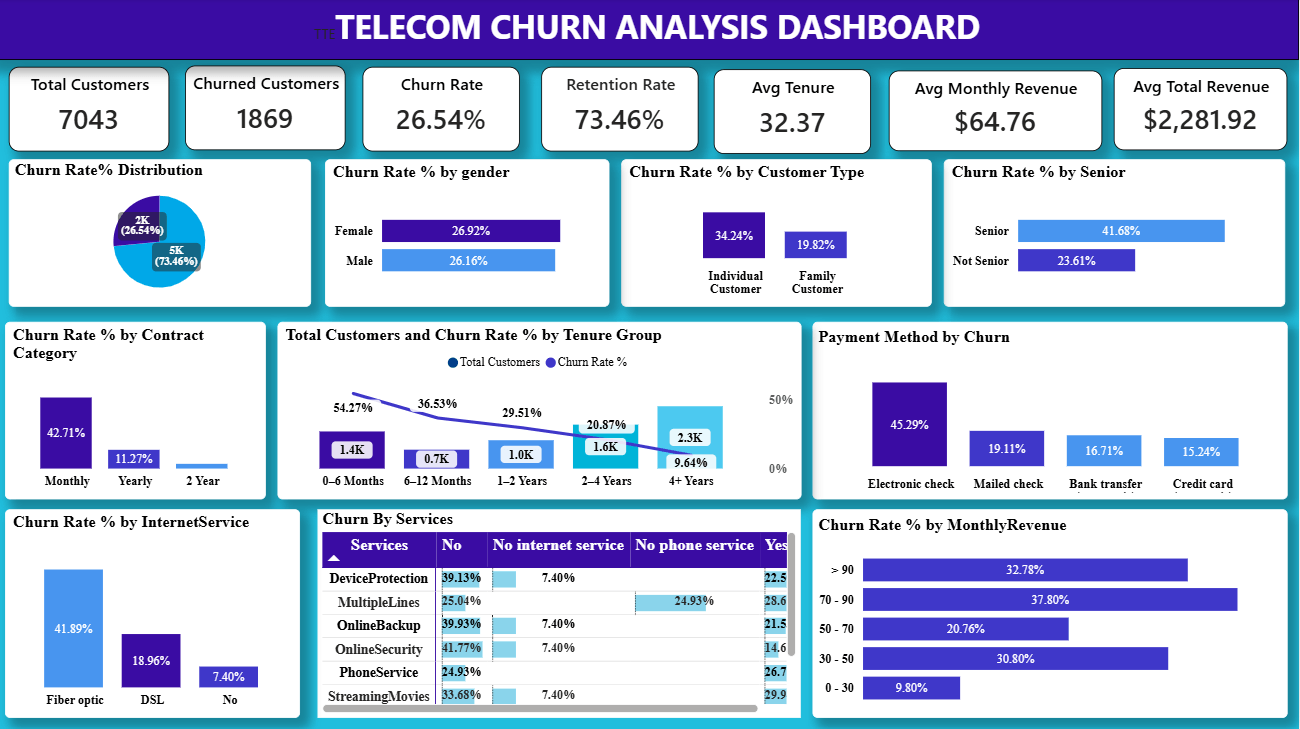
Built interactive views covering churn KPIs, contract and billing segmentation, and a filterable high-risk customer list the retention team can export and action directly.
The telecom customer churn analysis uncovered three clear patterns in the data is used in industry datasets and reports.
The 28-month tenure gap is the most important number in this project. Churned customers left after a median of just 10 months — meaning the problem is not losing loyal subscribers. It is failing new ones before they settle in. The intervention point is the first year, not win-back campaigns later.
Churned customers paid a median of ₹79.7/month versus ₹64.5 for retained ones. This is not simply a case of "charge less." Higher-charge customers are disproportionately on month-to-month contracts with fewer bundled services—the pricing correlates with contract structure and service usage, not standalone billing amount.
The average churn probability across all 7,043 customers was 0.27 — matching the overall 26.58% churn rate closely, which validates the model. More importantly, 6.33% of customers scored above a 0.70 probability. This segment — roughly 446 customers — is the retention team's priority list. They are significantly more likely to leave than the rest of the base, and any retention budget is most efficiently spent here.
The average churn probability across all 7,043 customers was 0.27 — matching the overall 26.58% churn rate closely, which validates the model. More importantly, 6.33% of customers scored above a 0.70 probability. This segment — roughly 446 customers — is the retention team's priority list. They are significantly more likely to leave than the rest of the base, and any retention budget is most efficiently spent here.
Based on this telecom customer churn analysis, here are six actions the retention team can act on immediately
Three factors—pricing pressure on month-to-month contracts, early-stage disappointment in the first year, and the lack of proactive retention contact before customers decide to leave—are the main causes of customer churn in the telecom industry, according to the analysis.
The Random Forest model wasn’t the most difficult aspect of this project; rather, it was fighting the desire to start modeling before knowing what the company really needed. Only when the results directly relate to a choice that can be made on Monday morning is telecom customer churn analysis useful. This is what the high-risk customer list and churn probability scores provided: a list to take action rather than a figure to display.
The company are able to move from reactive churn management—responding after customers depart—to proactive customer retention by combining descriptive analysis and predictive modeling, safeguarding both revenue stability and customer happiness. The actual result of this project is that change.
The complete SQL schema, Python notebooks, feature engineering code, and Power BI dashboard files are all available. If you are working on a customer retention or churn prediction project, connect on LinkedIn — I am happy to discuss the approach.