

Unlock everything. Free.
Your data career starts with one click.
Takes seconds. No spam, ever.
A data analyst case study showing how I developed, constructed, and deployed an end-to-end forecasting application, transforming from a business issue to a live, interactive solution.
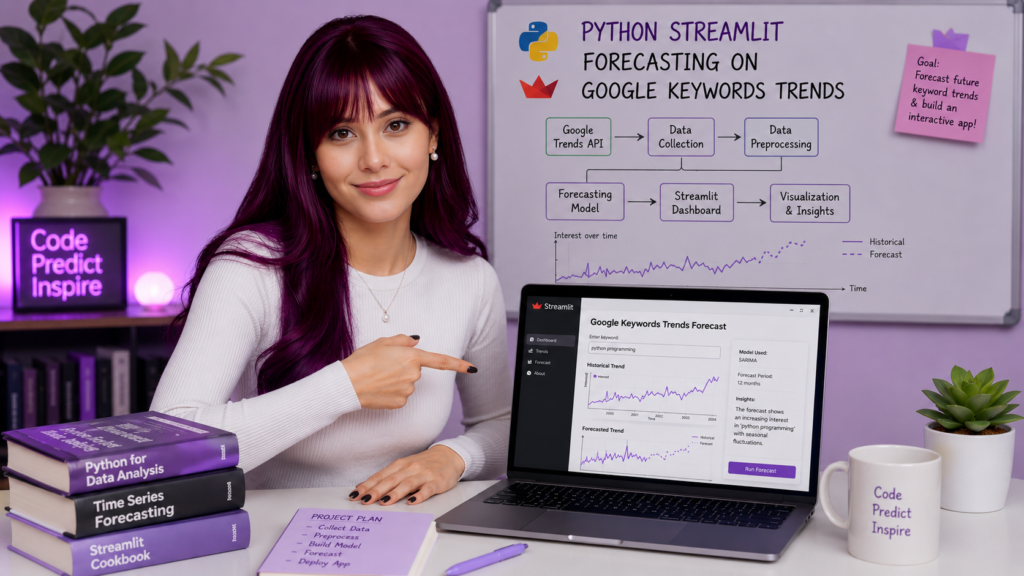
This data analyst case study describes my first full data analytics project in the same way I would explain it to a hiring manager: the business problem, why I made the decisions I did, what the data looked like, how the model performed, and, most importantly, what I would do differently next time.
Trend analysis is usually descriptive, not predictive — businesses react late instead of planning ahead.
A forecasting app that predicts future Google search interest for Data Analytics, ML, and AI.
Live data via Pytrends → cleaning → Prophet modeling per keyword → RMSE evaluation → Streamlit deployment.
A live, interactive dashboard with forecasts, seasonality breakdowns, and downloadable results.
Live App: keywords-trends-time-series-forecasting.streamlit.app
I chose this as my first project purposefully. I didn’t want to start with a clean, pre-packaged Kaggle CSV—I wanted to work with something more like what a working analyst would encounter: live, noisy, API-sourced data with no guaranteed structure.
Personally, I am interested in search trends. As someone who is actively looking for work in data analytics, I was curious: is there an increase in need for these skills? Is it seasonal? Can it be predicted with any reliability? That interest sparked the idea for the project.
This data analyst case study also provided me with the opportunity to work across the whole analytics lifecycle, from data collection to implementation.
The goal of this data analyst case study was to turn descriptive search trends into actionable forecasts.
Problem Statement: Analyze Google search interest data and estimate future trends for key technical areas to help with marketing planning, content strategy, and skill demand analysis.
Search interest is a leading indicators that businesses already use informally—content teams track “what’s trending,” and recruiters track which skills are most frequently searched. However, nearly none of this is forecasted in advance. I intended to close the gap by extending the trend line rather than simply showing it.
| # | Hypothesis | Why It Mattered |
|---|---|---|
| H1 | Search interest for tech keywords shows seasonal patterns | Determines if naive trend extrapolation would be misleading |
| H2 | Prophet can effectively model noisy Google Trends data | Validates the model choice for this specific, volatile data source |
| H3 | Interest levels vary significantly across keywords | Tests whether one model setup generalizes across topics |
| H4 | Short-term forecasting gives actionable planning signals | Connects the technical output back to business usefulness |
I made an early design decision that affected the entire project: the data needed to be live rather than a one-time static export. Every time the program runs, it pulls current numbers from Google Trends, therefore the pipeline has to be adaptable to changing data each time, rather than adjusted to a single constant snapshot.
This stage was more important than I expected—Google Trends data isn’t totally uniform across keywords, and getting the structure correct before modeling saved a lot of time debugging later.
For this data analyst case study, I assessed each keyword individually to see how the forecasting approach worked across different search trends.
I trained a separate Prophet model for each phrase rather than a combined model because the volume and pattern of the three search terms differed. For each keyword, the model divided the series into:
Model performance for each keyword was assessed using RMSE (Root Mean Squared Error), which provides a solid, comparable measure of forecast accuracy across the three series rather than depending just on visual assessment.
| KPI | Purpose |
|---|---|
| Search interest trend | Shows historical direction of interest |
| Forecasted interest values | Projects future demand |
| Seasonal patterns | Flags recurring cycles that shouldn’t be mistaken for real growth/decline |
| Trend direction | Upward / stable / declining classification |
| RMSE | Quantifies model reliability |
If you’re interested in how I use Python across different projects, check out my data analytics projects.
The final deliverable is not a notebook, but rather a deployable, interactive Streamlit app created for non-technical users to explore without touching any code. The final dashboard brings the different stages of this data analyst case study together in one interactive application.
See the dashboard in action
One of the most significant aspects of this data analyst case study was understanding how the technical model translated into obvious business signals.
The major change for me wasn’t technical; it was learning that a “trend chart” and a “forecast” answer two very distinct business issues. One person tells you what happened. The other advises you what you should do next.
This data analyst case study employs Python, the Pytrends API for real-time Google Trends data, Prophet (Meta/Facebook) for forecasting, Pandas and NumPy for data management, and Streamlit for the interactive dashboard.
Prophet was chosen because it handles seasonality, trend variations, and noisy real-world data well, with little manual tuning required—making it suitable for a first-time series forecasting project based on live, unpredictable Google Trends data.
It demonstrates end-to-end data analyst skills, including framing a business problem, working with live API data, cleaning and structuring time series data, developing and testing a forecasting model, and deploying a usable, interactive application.
Yes. The Streamlit dashboard is deployed live and publicly accessible at keywords-trends-time-series-forecasting.streamlit.app, with no login required to explore the forecasts.
The main disadvantages are a short 6-month data frame that limits identification of yearly seasonality, a fixed set of three tracked keywords, and reliance on RMSE as the only accuracy statistic without directional accuracy tests.
This was my first project, and I developed it without a roadmap to follow, so many decisions (live data fetching, per-keyword modeling, what to include on the dashboard) were entirely mine to make and defend. That’s the kind of decision I believe is more important than any one tool or library, and it will serve as the guiding principle for any projects following this one.
If you’d like the shorter, story-style version of this project, check out my behind-the-scenes blog post on how this build came together.
Live App: keywords-trends-time-series-forecasting.streamlit.app