Festive Season Funnel Analysis: Where Diwali Marketing Campaigns Actually Convert
Level: Intermediate | Tools: SQL (Excel or Power BI optional)
What you’ll learn
How to run a festive season funnel analysis: break a festive campaign down by funnel stage and channel, how to bring spend (CAC and ROAS) and delivery outcomes (RTO) into the picture, and how to avoid the attribution and new vs. returning traps.
Diwali is near, and if you’ve used a shopping app or social media lately, you’ve seen the offers. Flash sales, festive discounts, cashback deals, and early access for members. It is everywhere, and honestly, that is exactly what made me curious.
I started wondering what all of this looks like from the other side of the screen. When a brand runs multiple offers simultaneously, how can it accurately determine which ones were successful? Which channel brought real customers, and which one just brought clicks? That felt like a perfect data problem to me, and it is the reason I decided to write this post.
If you are a data aspirant like me, I hope this gives you a practical way to see how festive season funnel analysis works in a scenario you already recognise from everyday life. Let’s explore it together.
Key takeaways
- Revenue growth alone doesn’t tell you which channel worked.
- A funnel that stops at “Purchase” misses cancellations and RTO, so extend it to “Delivered”.
- A high conversion rate can still hide a money-losing channel until you add spend (CAC and ROAS).
- Last-click attribution over-credits the channel that closes the sale and under-credits the ones that started the journey.
- New and returning customers should be compared separately.
The Problem: “Our Diwali Campaign Did Well” Isn’t an Answer
Every festive season, someone reports that revenue is up, and every year, that number answers almost nothing on its own.
Picture a hypothetical D2C brand, call it Pribloominmart. Diwali revenue is up 30% year-over-year. That single number can’t tell a stakeholder which channel to fund more heavily next year, whether the growth came from new customers or the same loyal base buying more, or whether a meaningful slice of those “sales” will bounce back as cancellations before the money ever settles.
To answer any of those questions, a festive season funnel analysis has to break the aggregate number down by funnel stage, channel, and eventually by cost and customer type. If you have not already, our companion piece on analysing Diwali sales spikes covers the broader picture that this article builds on.
What Is a Marketing Funnel, and Why Break It Down by Channel?
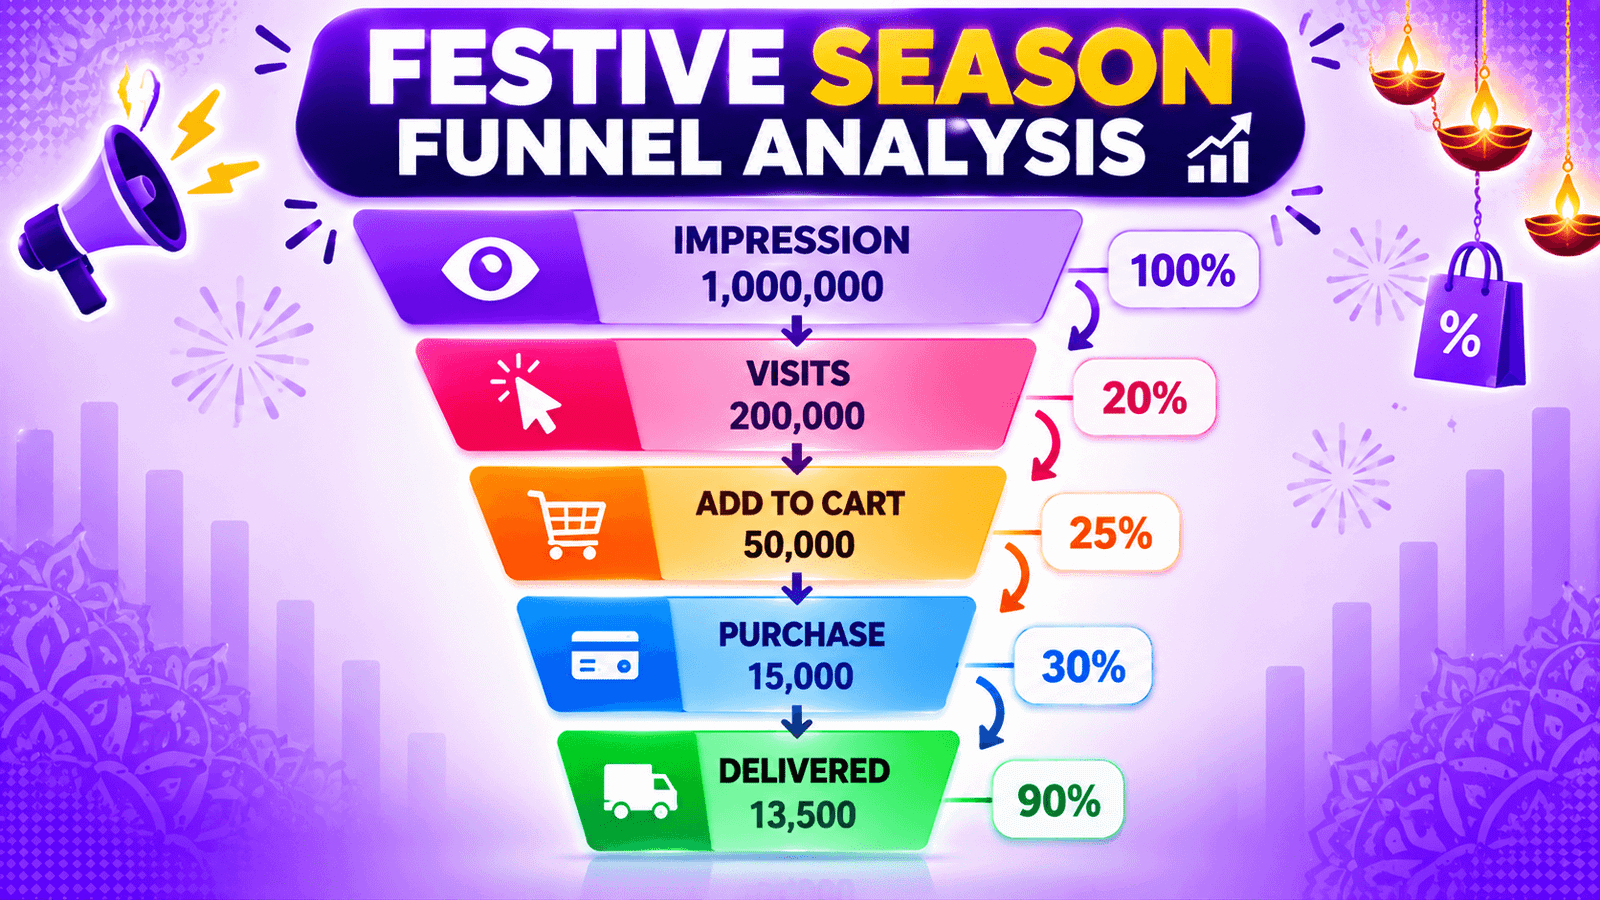
A marketing funnel breaks a customer’s journey into stages, and each stage answers a different question. Impressions ask, “Did anyone see this?” Clicks ask, “Did anyone care enough to look closer?” Add-to-cart asks, “Did they want to buy?” The purchase asks, “Did they actually pay?” In the Indian e-commerce context, there’s a stage most funnel articles skip entirely: Delivered, because a “sale” that gets returned or cancelled before it settles was never really a sale.
“A sale that gets returned or cancelled before it settles was never really a sale.”
| Funnel stage | What it measures | Example event |
|---|---|---|
| Impression | Did anyone see the ad or message? | Ad view, page view, email sent |
| Click | Did anyone engage? | Ad click, link click |
| Add to Cart | Did they consider buying? | Cart addition |
| Purchase | Did they place an order? | Order confirmed (COD or prepaid) |
| Delivered | Did the order actually complete? | Delivered, not returned or cancelled |
Breaking the data down by channel matters because different channels do different jobs in the funnel. A paid social ad might be excellent at generating impressions and clicks but weak at closing the sale. An email to an existing customer might convert at a much higher rate simply because that audience already trusts the brand. Comparing channels only on revenue hides which job each one is actually doing well.
Why Festive Periods Distort Funnels
During Diwali, discount-driven traffic can flood the top of the funnel without a matching increase in actual conversions. A channel that triples its clicks during a sale period isn’t necessarily three times better at converting; it might just be attracting more window shoppers chasing the discount. Looking only at click volume, the campaign looks like a smash hit. Looking at the click-to-purchase rate for that same channel, the picture can look very different.
Setting Up the Analysis: The Dataset
For this festive season funnel analysis. Everything from here on uses an illustrative dataset, not real company data, built to resemble what a mid-sized Indian D2C brand’s analytics stack might produce during a Diwali campaign window (15 October to 4 November, in this example, aggregated for the two channels below).
Note on the data
All numbers in this article come from an illustrative dataset I built for learning. They are not real company data.
Two tables carry the analysis:
campaign_funnel_events: one row per channel, per day, per funnel stage, with the spend attributable to that channel and day.
| event_date | channel | funnel_stage | customer_type | event_count | spend (₹) |
|---|---|---|---|---|---|
| 2026-10-20 | Instagram Ads | Impression | New | 42,000 | 15,000 |
| 2026-10-20 | Instagram Ads | Click | New | 2,100 | n/a |
| 2026-10-20 | Email/SMS | Impression | Returning | 17,000 | 300 |
| 2026-10-20 | Email/SMS | Click | Returning | 1,650 | n/a |
orders: one row per order, carrying its final outcome after delivery attempts.
| order_id | order_date | channel | customer_type | order_value (₹) | order_status |
|---|---|---|---|---|---|
| ORD10432 | 2026-10-20 | Instagram Ads | New | 1,200 | Delivered |
| ORD10433 | 2026-10-20 | Instagram Ads | New | 1,150 | RTO |
| ORD10434 | 2026-10-20 | Email/SMS | Returning | 1,300 | Delivered |
| ORD10435 | 2026-10-20 | Email/SMS | Returning | 1,180 | Cancelled |
order_status is what makes this dataset different from a typical funnel example, carrying three outcomes (Delivered, Cancelled, RTO) instead of collapsing everything into a single “Purchase” event. That’s what lets the next section check whether a channel’s “sales” actually held up, not just whether they were placed.
Calculating Conversion Rate by Stage and Channel
What question are we answering? Where in the funnel does each channel lose people, and how does that compare across channels?
What does the query calculate? The stage-to-stage conversion rate per channel, using LAG() to compare each stage’s count against the one before it.
-- Question: At each funnel stage, how well is each channel converting during the festive window?
WITH stage_counts AS (
    SELECT
        channel,
        funnel_stage,
        SUM(event_count) AS total_count
    FROM campaign_funnel_events
    WHERE event_date BETWEEN '2026-10-15' AND '2026-11-04'
    GROUP BY channel, funnel_stage
),
stage_ordered AS (
    SELECT
        channel,
        funnel_stage,
        total_count,
        LAG(total_count) OVER (
            PARTITION BY channel
            ORDER BY CASE funnel_stage
                WHEN 'Impression' THEN 1
                WHEN 'Click' THEN 2
                WHEN 'Add_to_Cart' THEN 3
                WHEN 'Purchase' THEN 4
            END
        ) AS previous_stage_count
    FROM stage_counts
)
SELECT
    channel,
    funnel_stage,
    total_count,
    ROUND(100.0 * total_count / NULLIF(previous_stage_count, 0), 1) AS stage_conversion_pct
FROM stage_ordered
ORDER BY channel,
CASE funnel_stage WHEN 'Impression' THEN 1 WHEN 'Click' THEN 2 WHEN 'Add_to_Cart' THEN 3 WHEN 'Purchase' THEN 4 END;| channel | funnel_stage | total_count | stage_conversion_pct |
|---|---|---|---|
| Instagram Ads | Impression | 500,000 | n/a |
| Instagram Ads | Click | 25,000 | 5.0% |
| Instagram Ads | Add to Cart | 6,250 | 25.0% |
| Instagram Ads | Purchase | 1,875 | 30.0% |
| Email/SMS | Impression | 200,000 | n/a |
| Email/SMS | Click | 20,000 | 10.0% |
| Email/SMS | Add to Cart | 8,000 | 40.0% |
| Email/SMS | Purchase | 4,000 | 50.0% |
On click-to-purchase alone, email/SMS (20%) beats Instagram ads (7.5%) by a wide margin. On this table alone, the obvious conclusion is “shift budget from Instagram to email”. That conclusion is premature: it ignores what each channel costs and what happens to those orders after they’re placed.
Tying Conversion to Spend: CAC and ROAS
Why does it matter? A high conversion rate on an expensive channel can still lose money; a low conversion rate on a nearly free channel can still be extremely profitable. Conversion rate alone can’t tell them apart.
What decision could use this? Where to increase or cut the ad budget for next year’s festive campaign.
-- Question: After accounting for spend and delivery outcomes, which channel is actually worth scaling?
WITH channel_spend AS (
    SELECT channel, SUM(spend) AS total_spend
    FROM campaign_funnel_events
    WHERE event_date BETWEEN '2026-10-15' AND '2026-11-04'
    GROUP BY channel
),
channel_orders AS (
    SELECT
        channel,
        COUNT(*) AS total_orders,
        SUM(CASE WHEN order_status = 'Delivered' THEN 1 ELSE 0 END) AS delivered_orders,
        SUM(CASE WHEN order_status = 'Delivered' THEN order_value ELSE 0 END) AS delivered_revenue
    FROM orders
    WHERE order_date BETWEEN '2026-10-15' AND '2026-11-04'
    GROUP BY channel
)
SELECT
    co.channel,
    co.total_orders,
    co.delivered_orders,
    ROUND(100.0 * co.delivered_orders / NULLIF(co.total_orders, 0), 1) AS retention_rate_pct,
    cs.total_spend,
    ROUND(cs.total_spend / NULLIF(co.delivered_orders, 0), 2) AS cac_per_delivered_order,
    ROUND(co.delivered_revenue / NULLIF(cs.total_spend, 0), 2) AS realised_roas
FROM channel_orders co
JOIN channel_spend cs ON cs.channel = co.channel
ORDER BY realised_roas DESC;| channel | total_orders | delivered_orders | retention_rate_pct | total_spend (₹) | cac_per_delivered_order (₹) | realised_roas |
|---|---|---|---|---|---|---|
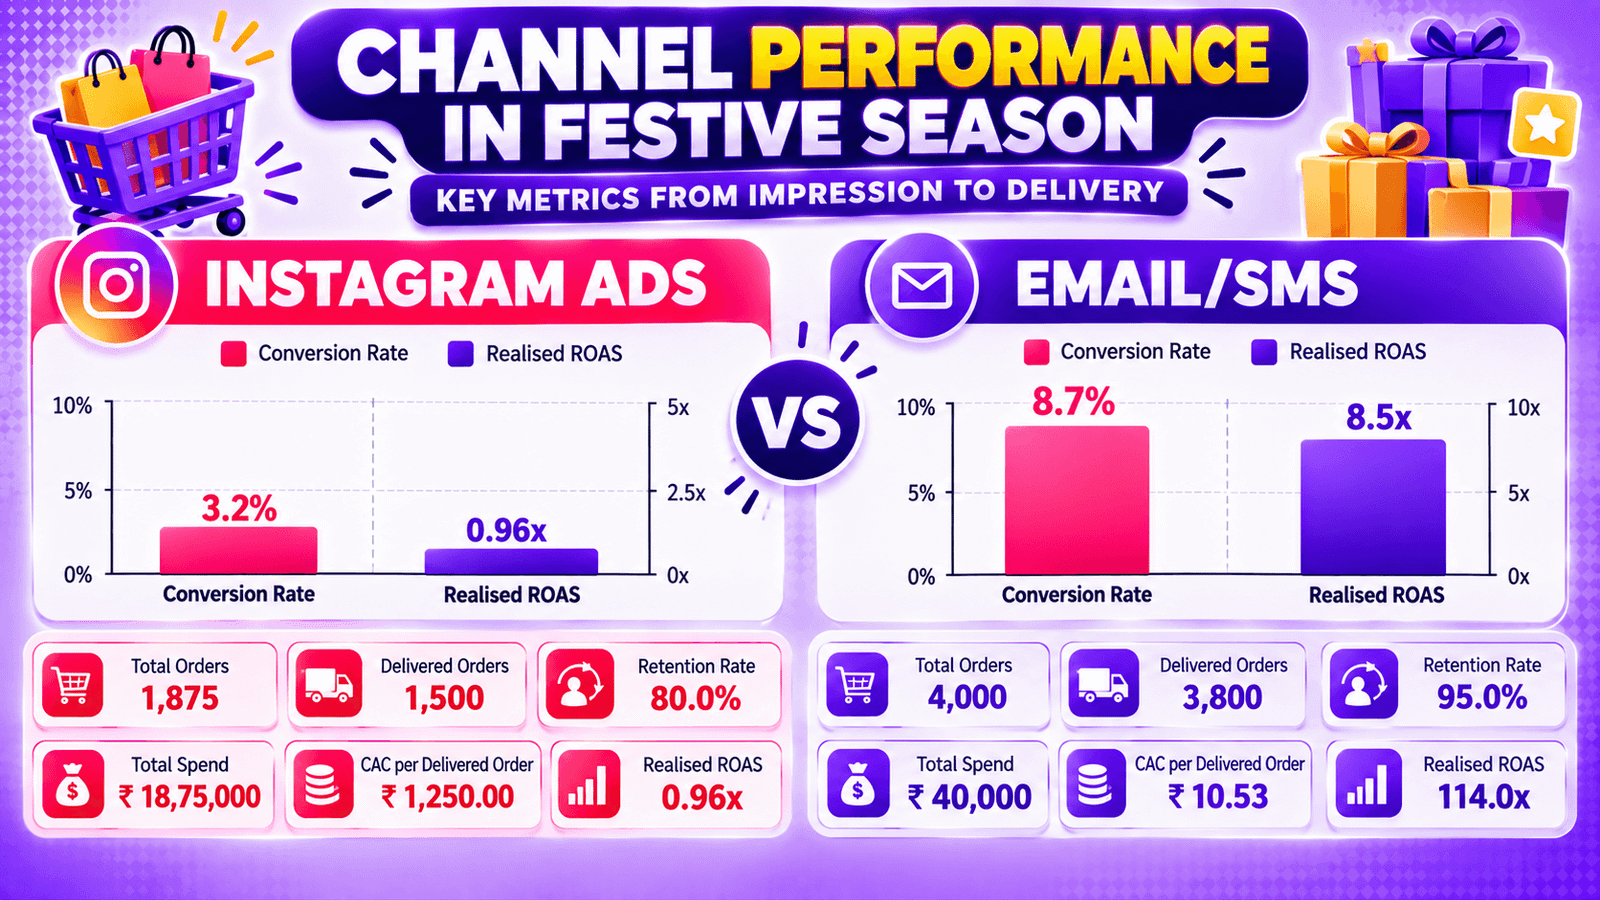
| Email/SMS | 4,000 | 3,800 | 95.0% | 40,000 | 10.53 | 114.0x |
| Instagram Ads | 1,875 | 1,500 | 80.0% | 1,875,000 | 1,250.00 | 0.96x |
This reframes the story completely. Instagram Ads, despite a respectable 30% cart-to-purchase rate, is realising a 0.96x ROAS after RTO, meaning it is, on this illustrative data, losing money once returns and delivery failures are accounted for. Email/SMS looks almost unfairly good, but that’s partly because it’s a nearly free channel talking to an audience that already trusts the brand, a point the next section unpacks further.
Spotting the “High Traffic, Low Conversion” Channel
Instagram Ads generated 500,000 impressions, by far the largest reach of the two channels. Judged on reach or on raw click volume, it’s the star performer. Judged on realised ROAS, it’s underwater. This is exactly the trap festive-season reporting falls into: a channel that looks dominant at the top of the funnel can be the one quietly losing money once spend and post-purchase outcomes are factored in.
Want to try this on your own data?
I’m building a practice dataset for this case study so you can run the same queries yourself. Follow me on LinkedIn or YouTube to get it when it’s ready. Meanwhile, you can practice on other datasets in the BloomInData Dataset Library.
Interpreting the Results: What the Numbers Are Actually Telling You
Every festive season funnel analysis is a snapshot of one window, and the CAC/ROAS table above is no exception. A conversion rate measured during a discount-driven spike may not hold outside it. Email’s 20% click-to-purchase rate is partly a festive-offer effect on an already-warm list, not proof that email will always convert at 20%. Before recommending a permanent budget shift, the same comparison would need to be checked against a non-festive baseline period.
There are two more nuances worth separating out before drawing conclusions.
The Attribution Caveat: Assists vs. Closers
During a month-long Diwali build-up, a single customer’s journey often spans several channels: a Facebook ad on day 1 (awareness), a Google search on day 10 (consideration), and a promotional email on day 14 that finally closes the sale. If the dataset only records last-click attribution, email gets 100% of the credit for that order, and Facebook, which started the journey, gets none.
Acted on literally, that data would say, “Cut the Facebook budget; it drove nothing.” In reality, Facebook was doing assist work that a last-click view can’t see. A simple correction (splitting credit evenly across the touchpoints in a journey or weighting the first and last touch more heavily) won’t perfectly solve attribution (that’s a deep topic on its own), but it’s enough to flag that a channel with a low last-click conversion rate isn’t automatically a channel worth cutting. It may be doing the harder, less measured job of starting the journey.
Why New vs. Returning Customers Can’t Be Compared Directly
In this dataset, Instagram Ads is 100% new customers, and Email/SMS is 100% returning customers, which already makes a head-to-head ranking unfair. Email isn’t “winning” because it’s a better channel in the abstract; it’s winning partly because it’s only ever talking to people who have already bought once, trust the brand, and are far more likely to convert regardless of channel.
The same trap shows up inside a single channel, too. Picture a broader “Paid Social” line that blends a new-customer prospecting campaign with a returning-customer retargeting campaign under one number. Reported together, it might show a middling 1.3x blended ROAS. Split by customer_type, the retargeting slice could be earning 4x ROAS, while the prospecting slice is underwater at 0.9x, two very different stories hiding inside one “okay” average. Whenever a channel serves both audiences, splitting by customer_type isn’t optional. It’s the difference between correctly diagnosing which half is broken and averaging away the diagnosis entirely.
Your turn
Re-run the CAC and ROAS query grouped by both channel and customer_type. Then answer three questions:
- Did the channel ranking change once new and returning customers were separated?
- What happens to your conclusion if you split “not delivered” into Cancelled vs. RTO?
- What would you recommend to a stakeholder, and what would you want to check first?
Need data to practice on? Browse the Dataset Library.
Share what you find in the comments or tag me on LinkedIn. I’d love to see how you approached it.
Common Mistakes in Festive Season Funnel Analysis
- Comparing raw revenue across channels without normalising for spend. A channel can have the highest revenue and still be the least profitable one, once cost is factored in.
- Stopping the funnel at “Purchase” instead of “Delivered”. This is the single biggest India-specific trap. Cash-on-delivery and festive impulse buying push cancellation and RTO rates up; a channel showing 1,000 orders at 40% RTO can deliver less real revenue than a channel showing 700 orders at 10% RTO. Reporting order counts alone would rank them the wrong way round.
- Treating last-click attribution as the full picture. As covered above, a channel that never closes a sale directly can still be essential to the journey that leads to one.
- Comparing new-customer channels against returning-customer channels without splitting the data. A retention channel (email, SMS) will structurally out-convert an acquisition channel (paid social, search) on conversion rate alone. That’s the nature of the audience, not proof the retention channel is “better”.
- Treating festive-period conversion rates as the year-round baseline. A number measured during a discount-driven spike needs to be checked against a non-festive period before it’s used to set next year’s budget.
Worked example: the RTO trap. If Instagram Ads’ 1,875 orders were reported as-is, it would look like the stronger channel by volume against Email/SMS’s 4,000 orders once revenue is calculated at face value. Once RTO is factored in (1,500 delivered vs. 3,800 delivered) and spend is brought in (₹18,75,000 vs. ₹40,000), the ranking on realised ROAS flips entirely, which is the whole reason this analysis works backwards from “Delivered”, not “Purchase”.
Quick check: 3 questions
1. Email/SMS has a 20% click-to-purchase rate and Instagram Ads has 7.5%. Why isn’t that enough to move the budget?
Answer: It ignores what each channel costs and what happens to orders after they’re placed (cancellations and RTO).
2. Channel A drives 1,000 orders with 40% RTO. Channel B drives 700 orders with 10% RTO. Which delivers more orders?
Answer: B. A delivers 600 orders and B delivers 630.
3. Why split results by customer_type?
Answer: Retention channels talk only to people who already trust the brand, so comparing them directly with acquisition channels isn’t fair.
Taking This Further: My End to End Marketing Analytics Project
The two channels in this article are deliberately simple. To see the same questions on a larger and messier dataset, I built an end to end project in MySQL and Power BI: Marketing Performance, Customer Acquisition & Lifetime Value Analytics.
It is not a Diwali dataset. It looks at marketing performance across 7 channels, 220 campaigns and 3,075 customers over 43 months, using six raw CSV files. The raw data needed real cleaning first: multiple date formats, 22 channel name variations, mixed currency symbols, duplicate records, negative spend and revenue values, and clicks greater than impressions.
What the project covers
- Data validation and cleaning in MySQL, followed by a star schema
- Funnel, CAC, LTV, ROAS, ROI, retention and cohort analysis
- 15 SQL scripts using window functions such as
ROW_NUMBER(),RANK(),NTILE()andPERCENT_RANK(), plus views and stored procedures - A 4 page Power BI dashboard: Executive Overview, Acquisition & Funnel, Campaign Performance, and Customer Economics & Retention
A few things I found in that data
- ROAS was 0.39 overall (₹23.01 Cr of spend against ₹8.92 Cr of revenue), and ROI was negative across every channel I analysed.
- LTV:CAC stayed below 1 for all channels, with Referral the highest at around 0.157.
- About 99.5% of leads never progressed to customers.
- Channel rankings moved over time: Display went from #1 to #4, Social from #4 to #1, and Email from #7 to #2.
That last point connects directly to this article. A channel ranking measured in one period is a snapshot, so it is worth checking across periods before moving budget.
View the project on GitHub, including the SQL scripts and the Power BI dashboard screenshots.
What to Learn Next
This festive season funnel analysis and its dataset extend naturally into three follow-up pieces:
- A Power BI dashboard built on this same funnel-and-spend data: see it in Building a Festive Season Sales Dashboard in Power BI.
- A discount vs. margin analysis: the natural next question after ROAS is whether the festive discount itself was sized correctly or whether it gave away margin that volume didn’t make up for.
- An interview-question companion piece: this same case study (funnel drop-off, CAC/ROAS, RTO, attribution) turned into interview-style business case questions.
If you’re working through this yourself, try re-running the second query split by customer_type on your own mock data, and see how much the ranking changes once New and Returning are no longer blended together. You can find more practice datasets in the BloomInData Dataset Library.
Frequently Asked Questions
What is festive season funnel analysis?
It means breaking a festive campaign into funnel stages (impression, click, add to cart, purchase, delivered) and comparing channels at each stage, instead of only reporting total revenue.
Why does RTO matter in Indian e-commerce analysis?
An order that is cancelled or returned to origin was never a real sale. A channel with many orders and high RTO can deliver less revenue than a channel with fewer, more reliable orders.
What’s the difference between CAC and ROAS?
CAC is what it costs to acquire a customer or delivered order. ROAS is the revenue you get back for every rupee of ad spend. CAC tells you the cost, and ROAS tells you the return.
Why compare new and returning customers separately?
Email and SMS mostly reach people who have already bought, so their conversion rates will naturally beat acquisition channels like paid social. The channels are doing different jobs.
Enjoyed this? Here’s what to do next
- Read next: Building a Festive Season Sales Dashboard in Power BI
- Practice next: Interview-style business case questions from this case study
- Get practice data: BloomInData Dataset Library
What would you check first in your own festive season funnel analysis?
Tell in the comments
About the author
I'm Priyanka Lakra, a self-taught data learner and  I explore the data ecosystem one concept, dataset and project at a time, and I share what I learn as I go, including the mistakes.. I share what I learn on BloomInData. Come explore it with me.