
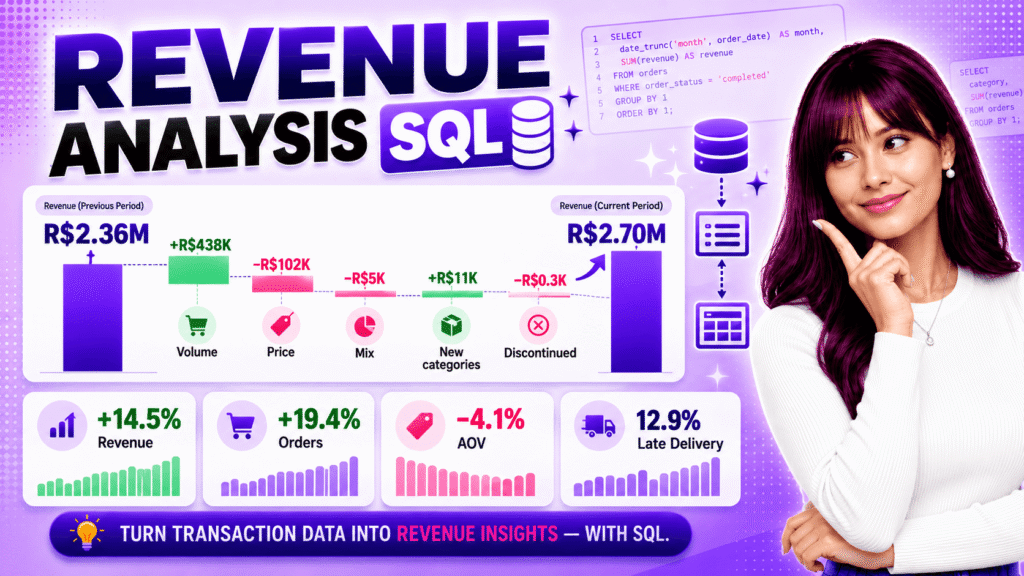
Revenue Grew 15% Last Quarter: Was It Volume, Price, or Product Mix?
Revenue is up about 15%, but why? A beginner-friendly revenue analysis in SQL on the Brazilian Olist dataset that splits growth into volume, price, and mix, with real outputs and a business recommendation.
Revenue Grew 15% Last Quarter: Was It Volume, Price, or Product Mix? Read Post »
